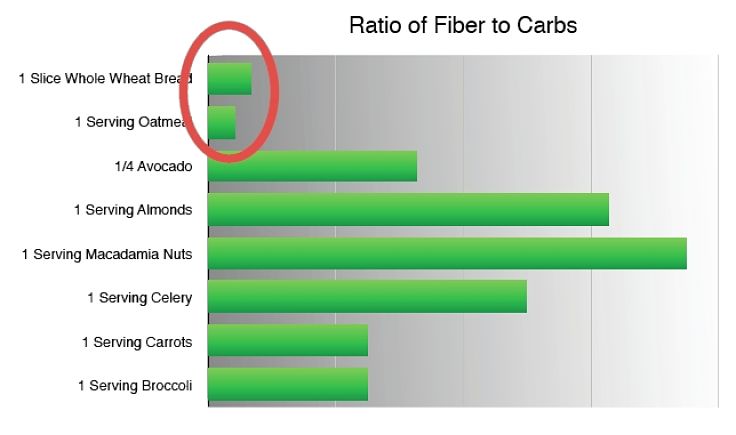
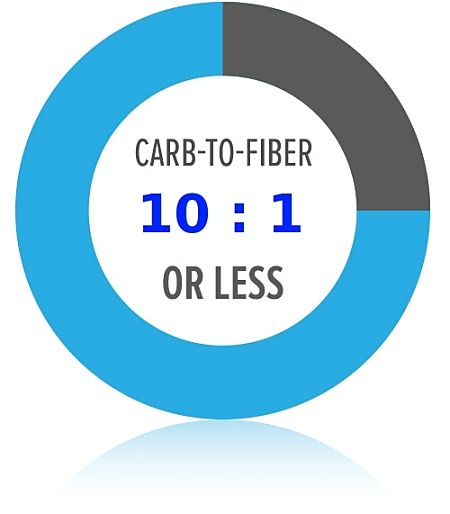
Choose Cereals and Grain Foods with Carbs to Fiber Ratios Less Than Ten to One (< 10:1)
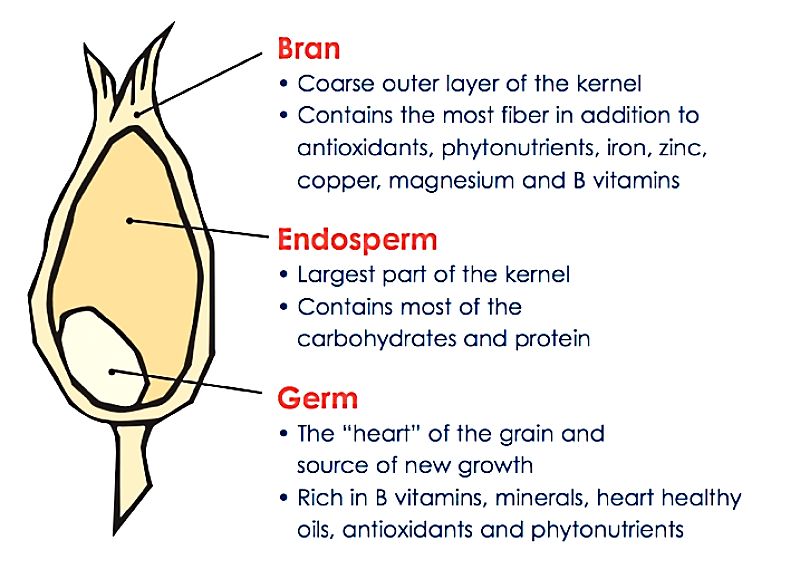
The term 'whole grain' or wholemeal can be misleading when included in the information for various food products. Both Oatmeal and the breakfast cereal 'Cheerios' are wholegrain. They are healthier than breakfast cereals such as Corn Flakes and Special K, from which the bran and germ in the grains have been removed by processing. Processed grain also lack the minerals and many vitamins that are in the original grains.
So why is steel-cut oatmeal, particularly when cooked slowly as a porridge generally healthier than Cheerios? The reason is that for Cheerios and other processed cereals the flour is highly processed and the wheat bran and germ is added back to qualify for the whole grain status. A lot of sugar is also added. This means that these processed cereals digest almost immediately, whereas oatmeal in rolled oats takes much longer to digest. Oatmeal also has a higher fiber content. A recent study showed that people who ate oatmeal for breakfast felt fuller for longer than those who consumed the same number of calories in processed cereal. So how can you choose a healthy breakfast cereal when the ones listed as 'whole grain' may be flawed?
The table below shows the amount of carbohydrate and fiber in a cup of flour produced from many whole grains.
Also shown, is the carbohydrate to fiber ratio.
For most grain flours the ratio is well below 10:1.
For rolled oats it is 6.8, for rye it is 5, hard white wheat it is 6.2, millet it is 8.6 and quinoa it is 9.
In contrast, Cornmeal has a ratio of 10.5 and brown rice 21.7, sorghum, and wild rice 12.
Carbohydrate and Fiber in Grain Flour ( 1 cup) and Carb to Fiber Ratio - Smallest at the Top
|
Flour ( 1 cup)
|
Calories
|
Carbohydrate (g)
|
Fiber (g)
|
Ratio Carbs to Fiver
|
|---|---|---|---|---|
|
bulgur
|
154
|
34.14
|
8.2
|
4.2
|
|
barley hulled
|
159
|
33.07
|
7.8
|
4.2
|
|
triticale
|
151
|
32.46
|
6.6
|
4.9
|
|
rye
|
152
|
34.14
|
6.8
|
5
|
|
wheat- red
|
147
|
32.03
|
5.5
|
5.8
|
|
wheat- hard white
|
154
|
34.16
|
5.5
|
6.2
|
|
Kamut
|
152
|
31.76
|
5
|
6.4
|
|
spelt
|
152
|
31.59
|
4.8
|
6.6
|
|
wheat- durum
|
153
|
32.01
|
4.82
|
6.6
|
|
rolled oats
|
171
|
30.47
|
4.5
|
6.8
|
|
buckwheat
|
154
|
32.18
|
4.5
|
7.2
|
|
millet
|
170
|
32.78
|
3.8
|
8.6
|
|
quinoa
|
166
|
28.87
|
3.2
|
9
|
|
teff
|
165
|
32.91
|
3.6
|
9.1
|
|
amaranth
|
167
|
29.36
|
3
|
9.8
|
|
cornmeal
|
163
|
34.6
|
3.3
|
10.5
|
|
sorghum flour
|
162
|
34.86
|
3
|
11.6
|
|
sorghum
|
153
|
33.58
|
2.8
|
12
|
|
wild rice
|
161
|
33.71
|
2.8
|
12
|
|
rice- brown
|
166
|
34.76
|
1.6
|
21.7
|
The Secret for a Healthy Breakfast Cereal - The Carbohydrate to Fiber Ratio
If you compare these values for whole grain flours with those of common processed breakfast cereals the differences are startling.
A serving of Corn Flakes, for instance, includes about 24 g of carbohydrate and 1 g of fiber, leading to a crabs to fiber ratio of 24.
Special K (Kelloggs) has 22 g of carbohydrate and 1 g of fiber, leading to a ratio of 22.
In contrast, Fiber One (General Mills) has 12.5 g of carbohydrate and 7 g of fiber, giving a ratio of 1.8.
All-Bran (Kelloggs) 11.5 g of carbohydrate and 5 g of fiber, giving a ratio of 2.3.
Beware that instant oatmeal can be a trap as it may contain a lot of added sugar.
The tables below provide listing of the carbohydrates and fiber in a variety of breads and breakfast cereals. The ones with the lowest card to fiber ration are listed as the top.
Research Study of Best Criteria for Choosing Healthy Whole Grain Products
► The industry-sponsored Whole Grain stamp
► WG as the first ingredient
► WG as the first ingredient without added sugars
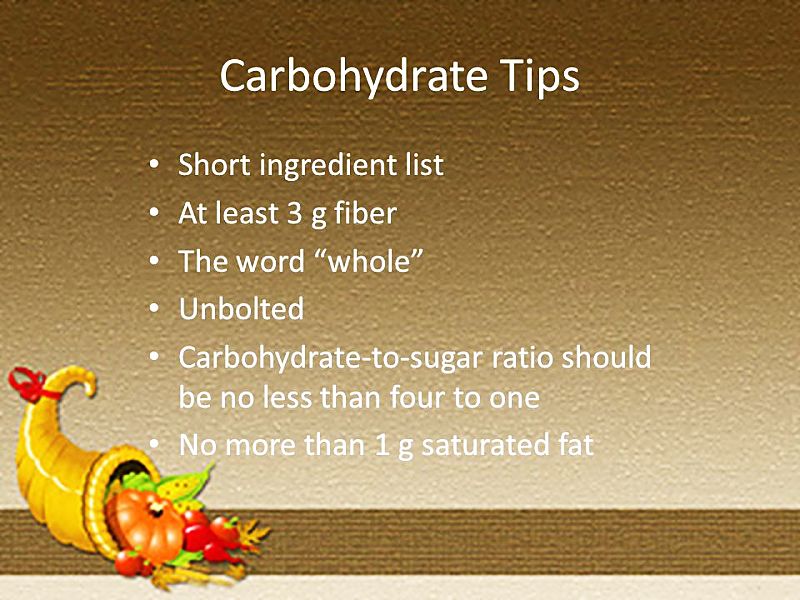
► The word ‘whole’ before any grain in the ingredients
► The total carbohydrate to fiber ratio (target 10:1 or less)
The study examined 545 grain products or fiber, sugars, sodium, energy, trans-fats and price using the above criteria.
The study found that the 10:1-ratio was the best in showing the largest differences, for products with ratios above and below 10:1.
Products achieving the 10:1-ratio also contained on average:
► less sugar
► less sodium
► lower risk of trans-fats being and ingredient.
The conclusion was that the 10:1-ratio clearly identified the healthiest Whole Grain products.
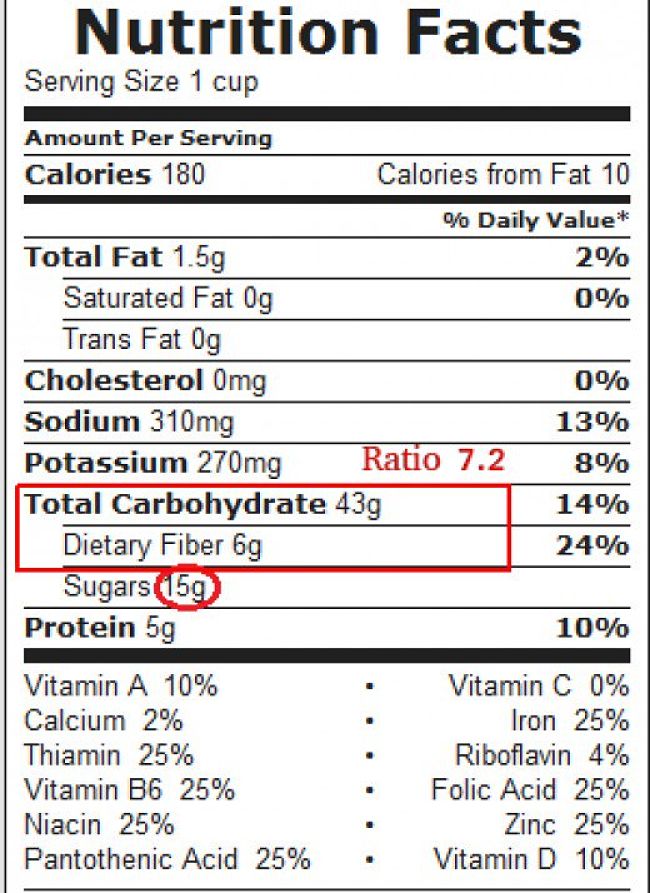
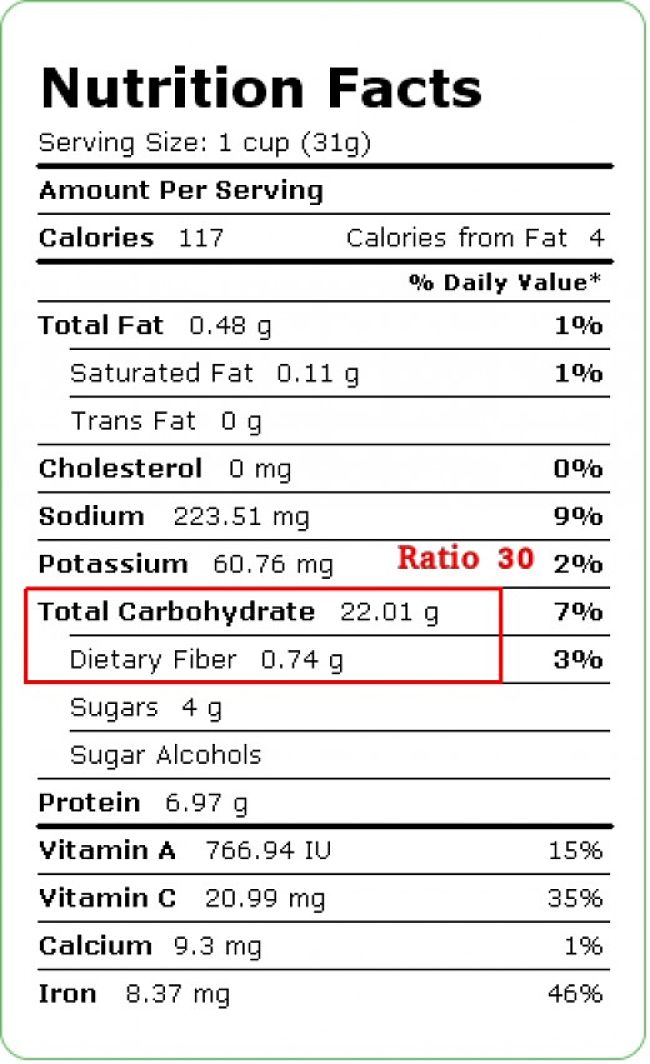
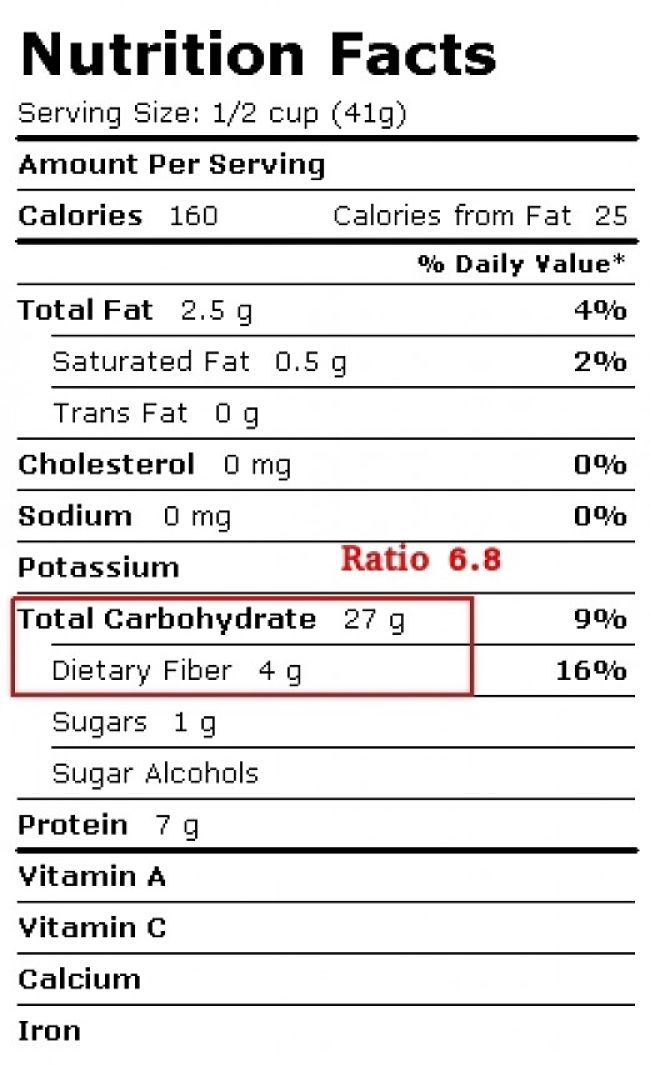
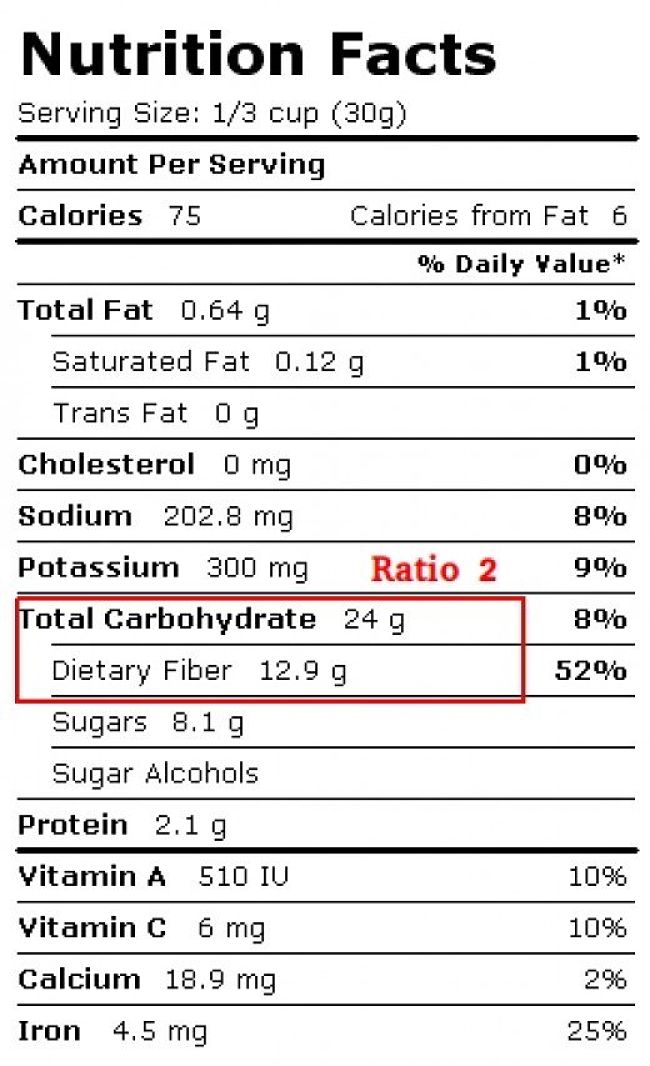
Rule of Thumb Guide for Calculating the Carbs to Fiber Ratio
You can do this easily by looking for Total Carbohydrate and Fiber contents on the Food Value labels attached to most products. Usually the listings are adjacent on the list. Several examples are shown in the images. It is a simply matter of doing some mental arithmetic. Divide the Total Carbohydrates by 10 which simply means shifting the decimal point to the left. For example, 23 becomes 2.3; 39 becomes 3.9. If this calculated value is less than the listed value for the fiber, the carbs to fiber ratio will be less than 10:1.
Carbohydrate and Fiber in Bread and the Carb to Fiber Ratio, with Highest Ratio at the top
|
Bread ( 1 serving)
|
Carbohydrate (g)
|
Fiber(g)
|
Carb to Fiber Ratio
|
|---|---|---|---|
|
Whole Wheat Bread
|
28
|
4
|
7
|
|
Pumpernickel Bread
|
34
|
4
|
8.5
|
|
Rye Bread
|
26
|
3
|
8.7
|
|
Boston Brown Bread
|
40
|
4
|
10
|
|
Sourdough Bread
|
24
|
2
|
12
|
|
Cornbread
|
26
|
2
|
13
|
|
Raisin Bread
|
27
|
2
|
13.5
|
|
Pita Bread
|
34
|
2
|
17
|
|
Bread Stick
|
40
|
2
|
20
|
|
English Muffin
|
60
|
3
|
20
|
|
French Bread
|
40
|
2
|
20
|
|
White Bread
|
25
|
1
|
25
|
|
Bagel (Egg Base)
|
31
|
1.2
|
25.8
|
|
Bagel (Water Base)
|
31
|
1.2
|
25.8
|
|
Rolls
|
39
|
1
|
39
|
|
Muffins
|
34
|
0.1
|
340
|
|
Croissant
|
54
|
0.1
|
540
|
Carbohydrate and Fiber in Breakfast Cereals and the Carb to Fiber Ratio, with Highest Ratio at the top
|
Breakfast Cereal (1 cup)
|
Calories
|
Carbohydrate (g)
|
Fiber(g)
|
Carb to Fiber Ratio
|
|---|---|---|---|---|
|
Fiber One (General Mills)
|
30
|
12.5
|
7
|
1.8
|
|
All-Bran (Kelloggs)
|
40
|
11.5
|
5
|
2.3
|
|
GOLEAN Cereal (Kashi)
|
140
|
30
|
10
|
3
|
|
Cheerios (General Mills)
|
100
|
20
|
3
|
6.7
|
|
Wheaties (General Mills)
|
75
|
16.5
|
2.25
|
7.3
|
|
Wheat Chex (General Mills)
|
120
|
28.5
|
3.75
|
7.6
|
|
Multi Grain Cheerios (General Mills)
|
110
|
23
|
3
|
7.7
|
|
Total (General Mills)
|
75
|
17.25
|
2.25
|
7.7
|
|
Kix (General Mills)
|
137.5
|
31.25
|
3.75
|
8.3
|
|
Smart Start Healthy Heart (Kelloggs)
|
287.5
|
57.5
|
6.25
|
9.2
|
|
Eggo Cereal Maple Syrup (Kelloggs)
|
120
|
22
|
2
|
11
|
|
Honey Nut Cheerios (General Mills)
|
82.5
|
16.5
|
1.5
|
11
|
|
Raisin Bran Crunch (Kelloggs)
|
190
|
45
|
4
|
11.3
|
|
Oatmeal Crisp Crunchy Almond (General Mills)
|
220
|
46
|
4
|
11.5
|
|
Yogurt Burst Cheerios Vanilla (General Mills)
|
90
|
18
|
1.5
|
12
|
|
Life (Quaker)
|
90
|
18.75
|
1.5
|
12.5
|
|
Basic 4 (General Mills)
|
200
|
43
|
3
|
14.3
|
|
Special K (Kelloggs)
|
120
|
22
|
1
|
22
|
|
Lucky Charms (General Mills)
|
82.5
|
16.5
|
0.75
|
22
|
|
Reeses Puffs (General Mills)
|
90
|
16.5
|
0.75
|
22
|
|
Cookie Crisp (General Mills)
|
75
|
16.5
|
0.75
|
22
|
|
Count Chocula (General Mills)
|
82.5
|
17.25
|
0.75
|
23
|
|
Cocoa Puffs (General Mills)
|
82.5
|
17.25
|
0.75
|
23
|
|
Corn Flakes (Kelloggs)
|
100
|
24
|
1
|
24
|
|
Honey Smacks (Kelloggs)
|
75
|
18
|
0.75
|
24
|
|
Crispix (Kelloggs)
|
110
|
25
|
1
|
25
|
|
Smorz (Kelloggs)
|
120
|
25
|
1
|
25
|
|
Mini-Swirlz Cinnamon Bun (Kelloggs)
|
120
|
25
|
1
|
25
|
|
Product 19 (Kelloggs)
|
100
|
25
|
1
|
25
|
|
Special K Red Berries (Kelloggs)
|
110
|
25
|
1
|
25
|
|
Cinnamon Toast Crunch (General Mills)
|
97.5
|
18.75
|
0.75
|
25
|
|
Froot Loops (Kelloggs)
|
120
|
26
|
1
|
26
|
|
Corn Chex (General Mills)
|
120
|
26
|
1
|
26
|
|
Golden Grahams (General Mills)
|
90
|
19.5
|
0.75
|
26
|
|
Frosted Flakes (Kelloggs)
|
82.5
|
20.25
|
0.75
|
27
|
|
Apple Jacks (Kelloggs)
|
120
|
28
|
1
|
28
|
|
Corn Pops (Kelloggs)
|
120
|
28
|
1
|
28
|
|
Trix (General Mills)
|
120
|
28
|
1
|
28
|
|
Franken Berry (General Mills)
|
130
|
29
|
1
|
29
|
|
Coco Pops (Kelloggs)
|
153
|
35
|
0.7
|
50
|
|
Rice Krispies Treats Cereal (Kelloggs)
|
90
|
19.5
|
0.1
|
195
|
|
Frosted Krispies (Kelloggs)
|
82.5
|
20.25
|
0.1
|
202.5
|
|
Rice Chex (General Mills)
|
100
|
23
|
0.1
|
230
|
|
Rice Krispies (Kelloggs)
|
150
|
36.25
|
0.1
|
362.5
|